Mr. Vleck
Harry S
Truman High School

INTRODUCTION
You have
been hired by the government to research and gather evidence on one of three
topics that have been hot button issues recently. The topics include: (1) steroid use in baseball, (2) teen
pregnancy and (3) climate change. As a
newly graduated statistics student, you are in a unique position to help the
government gather data, asses the data and draw relevant conclusions. Since you are still trying to find your way
in the world, you can also provide a completely non-partisan recommendation on
how the government should proceed.
TASK
Your job is
to choose one of the three topics listed and using the six steps of the Public
Policy Analyst (PPA) write a three page report and create a 10 minute power
point presentation. You will be divided
into groups of two or three to complete this assignment.
PROCESS/RESOURCES
Your group
will perform the following activities for the topic you choose.
·
gather
appropriate data on the topic
·
summarize
the data using appropriate graphs and tables
·
use
the results of the data to draw a conclusion
·
research
news or magazine articles to help you develop a solution to the problem
·
make
a recommendation to the government on how they should proceed
Use the PPA
worksheets to guide you through the project and help you write your paper. Links to each worksheet for each of the six
steps are below (note: each link will open up a word document you can then edit):
4. Evaluate the Existing Policy
While the
topics listed are broad in scope, you should choose to focus on one particular
aspect of the project. For example:
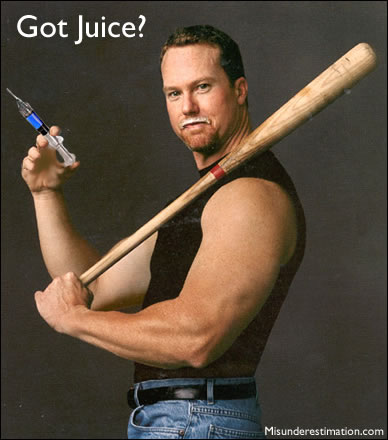
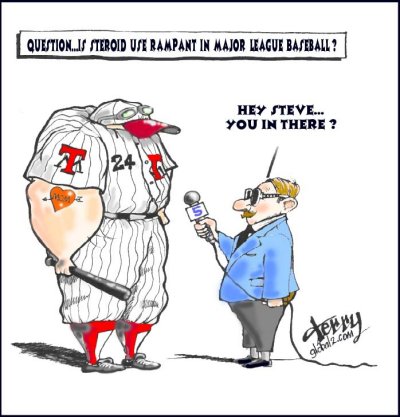
Steroid use in Baseball:
Has steroids become more prevalent over the years? Does steroid use prolong the career of a
baseball player? Does steroid use warp
baseball statistics (home runs, RBI's, etc)?
Does bringing up known steroid users on charges alter steroid use in
baseball?
|
|
|
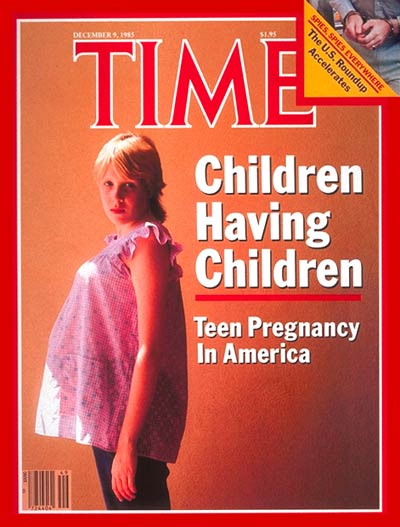
Teen Pregnancy:
Have government policies influenced teen pregnancy? Does access to abortion affect the number of
teen pregnancies? Does having free access
to contraceptives affect the number of teen pregnancies?
|
|
|
Climate Change:
Does having greater emission controls affect the climate? Has the introduction of green energy affected
the climate?
|
|
|


Please note
that you are not limited to the topics listed.
You may come up with your own, but it should fall within one of three main
categories.
After your
group has decided on a topic, it must be approved by your teacher.
Resources
you could use
|
Topic |
Data
Gathering |
Articles |
|
Steroid
use in baseball |
|
|
|
Teen
Pregnancy |
National Center for Health Statistics |
US Government report on pregnancy Link to several articles on contraception usage |
|
Climate
Change |
Generation of energy by source 2000-2010 |
Causes of Climate Change – EPA Has the earths' temperature changed? |
EVALUATION
When writing
your three page report, use the MLA guidelines.
Click here for the guidelines.
The
following rubric will be used for your research paper.
Group Members_________________________________ Grade______/ 25
|
|
5 |
4 |
3 |
2 |
1 |
|
Topic |
Clearly stated and appropriately
focused. |
Clearly stated but focus needed to
be sharper. |
Thesis stated but not appropriately
focused. |
Thesis is inferred but not stated. |
No statement of thesis or objective
for research observed. |
|
Quality of Information |
Information clearly related to the
main topic, included consistent supporting details and/or examples. |
Information clearly related to the
main topic, provided adequate supporting details and/or examples. |
Information clearly related to the
main topic, provided some supporting details and/or examples. |
Information related to the main
topic, no details or examples provided. |
Information had little or nothing to
do with main topic. |
|
Organization |
Information is logically organized. |
Information is adequately organized. |
Information is somewhat organized. |
Obvious lack of organization. |
No observable organization. |
|
Paragraph Construction |
All paragraphs include introductory
sentence, explanations or details, concluding sentence with a transition. |
Most paragraphs include introductory
sentence, explanations or details, concluding sentence with a transition. |
Paragraphs included related
information, but were typically not constructed well. |
Paragraph structure was not clear
and sentences were not typically related within the paragraphs. |
No paragraphs observed. |
|
Mechanics |
No grammatical, spelling or
punctuation errors observed. |
Almost no grammatical, spelling or
punctuation errors observed. |
A few grammatical, spelling or
punctuation errors observed. |
Many grammatical, spelling or
punctuation errors observed. |
No observable effort in the area of
mechanics. |
The
following rubric will be used for your presentation.
Group Members_____________________________________ Grade_____/ 16
|
4 |
3 |
2 |
1 |
|
|
Visual
Presentation |
Overall
visually appealing; not cluttered; colors and patterns enhance readability |
Overall
visually appealing; not cluttered; colors and patterns support readability |
Visual
appeal is adequate; somewhat cluttered; colors and patterns detract from
readability |
Not
very visually appealing; cluttered; colors and patterns hinder readability |
|
Readability |
Uses
font sizes/variations which facilitate the organization, presentation, and
readability of the research |
Adequate
use of font sizes/variations to facilitate the organization, presentation,
and readability of the research |
Use
of font sizes/variations to facilitate the organization, presentation, and
readability of the research is somewhat inconsistent/distracting |
Use
of font sizes/variations to facilitate the organization, presentation, and
readability of the research is inconsistent/distracting |
|
Use
of Graphics |
Graphics
(e.g., tables, figures, etc.) are engaging and enhance the text |
Graphics
(e.g. tables, figures, etc.) enhance the text |
Graphics
(e.g., tables, figures, etc.) adequately enhance the text |
Graphics
(e.g., tables, figures, etc.) do not enhance the text |
|
Content |
Content
is clearly arranged so that the viewer can understand order without narration |
Content
is arranged so that the viewer can understand order without narration |
Content
arrangement is somewhat confusing and does not adequately assist the viewer
in understanding order without narration |
Content
arrangement is somewhat confusing and does not adequately assist the viewer
in understanding order without narration |
CONCLUSION
Statistics
are used to enhance or refute claims made on a variety of topics in virtually
all facets of life. You have only
scratched the surface on how powerful statistics can be through researching this
project. But be warned, statistics can
and have been used to spin results towards one conclusion or the other. You have been given a very powerful gift, use
it wisely.
STANDARDS
LANGUAGE
ARTS STANDARDS
Standard
1: Language for Information and
Understanding
Students will listen, speak, read, and write for information and understanding.
As listeners and readers, students will collect data, facts, and ideas;
discover relationships, concepts, and generalizations; and use knowledge
generated from oral, written, and electronically produced texts. As speakers
and writers, they will use oral and written language that follows the accepted
conventions of the English language to acquire, interpret, apply, and transmit
information.
Standard 3: Language for
Critical Analysis and Evaluation
Students will listen, speak, read, and write for critical analysis and
evaluation. As listeners and readers, students will analyze experiences, ideas,
information, and issues presented by others using a variety of established
criteria. As speakers and writers, they will use oral and written language that
follows the accepted conventions of the English language to present, from a
variety of perspectives, their opinions and judgments on experiences, ideas,
information and issues.
Standard 4: Language for Social
Interaction
Students will listen, speak, read, and write for social interaction.
Students will use oral and written language that follows the accepted
conventions of the English language for effective social communication with a
wide variety of people. As readers and listeners, they will use the social
communications of others to enrich their understanding of people.
COMMON CORE STATE STANDARDS
4. Produce clear and coherent writing
in which the development, organization, and style are appropriate to task,
purpose, and audience.
5. Develop and strengthen
writing as needed by planning, revising, editing, rewriting, or trying a new
approach.
8. Gather relevant
information from multiple print and digital sources, assess the credibility and
accuracy of each source, and integrate the information while avoiding
plagiarism.
AP STATISTICS STANDARDS
I. Exploring Data: Describing
patterns and departures from patterns
A. Constructing
and interpreting graphical displays of distributions of univariate
data (dotplot, stemplot,
histogram, cumulative frequency plot)
B. Summarizing
distributions of univariate data
II. Sampling and Experimentation: Planning and
conducting a study
A. Overview of methods of data collection
1.
Census
2.
Sample survey
3.
Experiment
4.
Observations study
B. Generalizability
of results and types of conclusions that can be drawn from observational
studies, experiments and surveys
III. Statistical Inference: Estimating
population parameters and testing hypotheses
A. Estimation
(point estimators and confidence intervals)
1.
Estimating population parameters and
margins of error
2.
Properties of point estimators,
including unbiasedness and variability
3.
Logic of confidence intervals, meaning
of confidence level and confidence intervals, and properties of confidence
intervals
4.
Large sample confidence interval for a
proportion
5.
Large sample confidence interval for a
difference between two proportions
6.
Confidence interval for a mean
7.
Confidence interval for a difference
between two means (unpaired and paired)
B. Tests
of significance
1.
Logic of significance testing, null
and alternative hypotheses; p-values; one- and two-sided test; concepts of Type
I and Type II errors; concepts of power
2.
Large sample test for a proportion
3.
Large sample test for a difference
between two proportions
4.
Test for a mean
5.
Test for a difference between two
means (unpaired and paired)