
Cynthia Thomas
Ditmas I.S. 62 Brooklyn
Introduction:
There is no smell of food cooking on the stove when you enter the house. Check out the refrigerator, there’s only one carton of milk, half empty, on the shelf and two cans of Arizona iced tea on the door. The cabinet has three boxes of macaroni and two cans of lima beans. Maybe Mom will bring something home. Pizza, that would be great. It’s only the 23th of the month, there’s no money left on the EBT card. You know this means you’ll be headed to the food pantry.
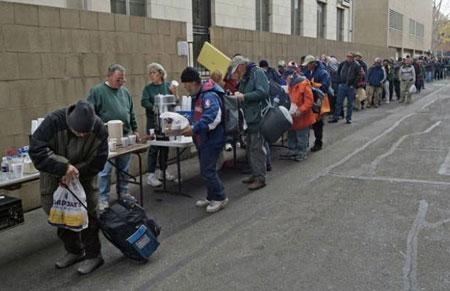
Hunger is not what people think of when you say New York City, but the reality is there are a large number of people that go hungry every day in the Big Apple.

Task:
You have volunteered to be part of Mayor De Blasio’s task force in New York City to develop a new policy that addresses the issues of hunger in New York City. Your objective is act as a public policy analyst in order to develop solutions to this problem.
You will work as a team in groups of 4 to create a PowerPoint presentation to explore the social problem of hunger in New York City. You will use the Public Policy Analysis (PPA) to analyze this social problem.

The Process:
You will use the PPA, each link will provide you with information needed to complete each step of the PPA:
Public Policy Analyst Steps
Each step is explained in the links below.
The 6 Steps of the Public Policy Analyst (PPA)
Using the links found here you will find the resources to analyze this problem.
http://www.livebinders.com/play/play/1333199
Use the worksheets below to organize your work.
· Worksheet 1: Define the Problem
· Worksheet 2: Gather the Evidence
· Worksheet 3: Identify the Causes
· Worksheet 4: Examine an Existing Policy
· Worksheet 5: Develop Solutions
· Worksheet 6: Select the Best Solution

Evaluation:
Conclusion:
This web quest helped students to develop an awareness of the issue of hunger in New York City. Students explored the populations that are impacted by hunger. They analyzed the factors that contribute to hunger. Additionally they investigated the effects of hunger on individuals. Students explored the current policies in place to handle this problem. Finally they came up with a policy to help increase the awareness of this problem.
Standards:
CCSS.ELA-Literacy.RST.6-8.7 Integrate quantitative or technical information expressed in words in a text with a version of that information expressed visually (e.g., in a flowchart, diagram, model, graph, or table).
CCSS.ELA-Literacy.RST.6-8.8 Distinguish among facts, reasoned judgment based on research findings, and speculation
CCSS.ELA-Literacy.RST.6-8.7 Integrate quantitative or technical information expressed in words in a text with a version of that information expressed visually (e.g., in a flowchart, diagram, model, graph, or table).