Testing Anxiety
3-301
Ms. Segarra
INTRODUCTION
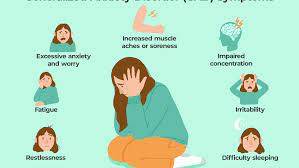
Anxiety is a feeling of worry, nervousness, or uneasy. Anxiety has become an even bigger issue since
the pandemic. What happens to our brain
when we are anxious?
TASK
How can we help
others with anxiety?
Day 1: Define the problem: Write a
clear explanation about what anxiety is on google slides. Then use that explanation to create your own
survey of questions you want to ask students about anxiety.
Day 2 and 3: Gather evidence: from other
students in the school or even at home. Share your google form with others to
get your responses.
Day 4: Collect the evidence that
you have gathered and create a table/graph showing your results.
Day 5: Identify the causes: Based
on the information you collected, list some possible causes of anxiety.
Day 6: Evaluating the Existing
Policy:
Day 7: Develop a Solution: Discuss
with your partner(s) some possible solutions for the problem and explain how
your solution may help other students.
PROCESS/RESOURCES
You will be working in pairs (by the teacher) for this
project. You will be using various forms
of technology. You will have to create a
google slides presentation for your project.
You will also have to create a google form (survey) to collect your
information. You will have to make a
graph/table (it can be done either on the computer or by hand. You will also have to present your project on
FlipGrid.
Remember to be clear and concise when you are presenting.
You must use the PPA steps in your presentation.
Step 1: Define the Problem
Step 2: Gather Evidence
Step 3: Identify the Causes
Step 4: Evaluate an Existing
Policy
Step 5: Develop Solutions
Step 6: Select the Best Solution
Resources you will need:
Google Slides
Google Form
EVALUATION
CONCLUSION
In this unit,
we learned about:
1.
Anxiety
❖ What is it?
❖ What are some causes of it?
❖ What are some solutions that
can help us?
1.
How to do research
2.
How to graph information that
we have found.
STANDARDS
English Language Arts:
3W6: Conduct research to answer
questions, including self-generated questions, and to build knowledge.
Math:
3.MD.B.3Draw a scaled
picture graph and a scaled bar graph to represent a data set with several
categories. Solve one- and two-step "how many more" and "how
many less" problems using information presented in scaled bar graphs. For example, draw a bar graph in which each
square in the bar graph might represent 5 pets.