
Too Much
Plastic Waste
Amelia Mack Kelly
Introduction:
Did you know that citizen science is the practice of public participation and collaboration in scientific research to increase scientific knowledge. Through citizen science, people share and contribute to data monitoring and collection programs.
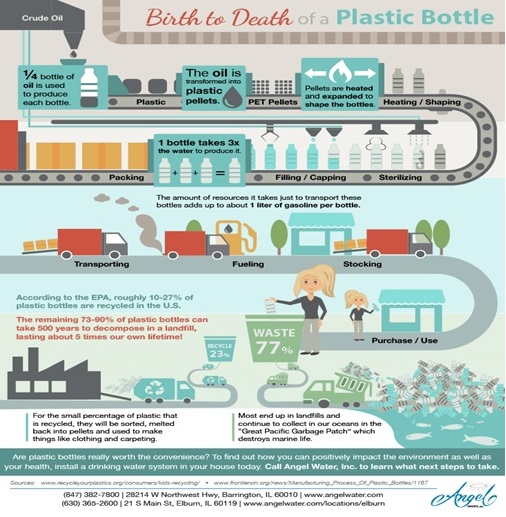
As you know, on March 1, 2020, New York became the third state to ban the distribution of single-use plastic shopping bags to consumers in order to reduce waste and environmental impact. As a Citizen Scientist, you will be examining this problem of
the overuse of plastics, and its impact it has had on ocean environments and marine life.
You will come up with other possible solutions to further reduce plastic waste (using Public Policy Analyst). You will present your solution(s) by either creating a PowerPoint, Google Slides presentation, or design an infographic poster.
Tasks:
Your group will create a PowerPoint, Google Slides presentation, or design an infographic poster on possible solutions to further reduce plastic waste using the 6 PPA Steps.
Process
PowerPoint
or Google slides:
Your group will be using the 6 Steps of Public Policy Analyst (PPA). You will create a title for your presentation and include the names of each group member. Make sure to have 2 or 3 slides for each step of the PPA.
4. Evaluate an Existing
Policy
6. Select the Best
Solution (Feasibility vs. Effectiveness)
Designing an Infographic Poster:
Your group will also be using the 6 Steps of Public
Policy Analyst (PPA) to create your poster. You may use PowerPoint or Google
Slides to record your work and information as you work your way through the 6
steps. You can then use Piktochart to help you
How to create an infographic links and videos:
You can use piktochart and watch the demo video to give you an idea of what an infographic is.
Article on the impact of Infographics:

A few examples:

Resources:
· Read: https://www.nationalgeographic.org/encyclopedia/citizen-science/
· Read: https://www.iucn.org/resources/issues-briefs/marine-plastics
· Read: https://www.nationalgeographic.com/environment/2018/07/ocean-plastic-pollution-solutions/#close
· Read: https://theintercept.com/2019/07/20/plastics-industry-plastic-recycling/?comments=1
· Watch: https://ed.ted.com/lessons/what-really-happens-to-the-plastic-you-throw-away-emma-bryce
Evaluation:
Infographic rubric:
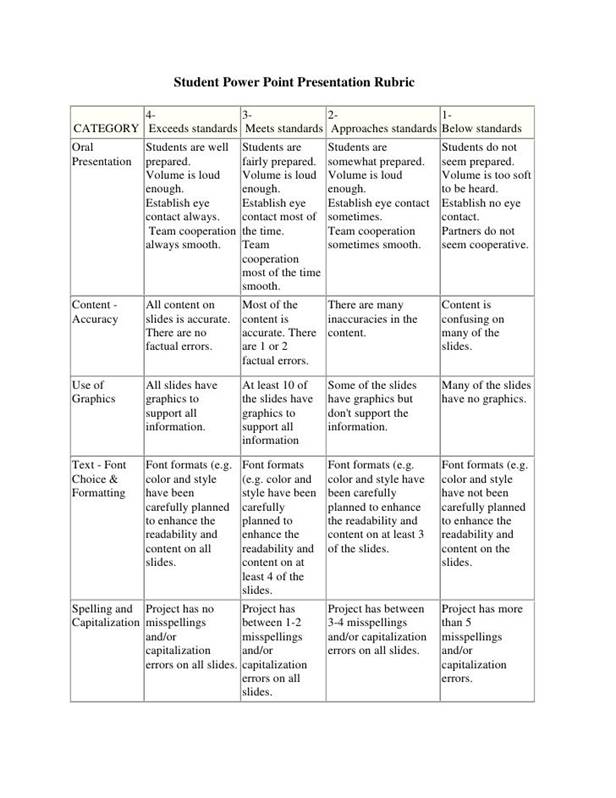
PowerPoint and Slides Rubric:
Conclusion:
You created a slideshow (PowerPoint or Google Slides) that includes other solutions that will help reduce the amount of plastic waste by gathering research, interpreting data, formulating your ideas into solutions by using the 6 Steps of a PPA, and communicating your information to others.
Standards:
NGSS
MS-LS2-1:
Analyze and interpret data to provide evidence for the effects of resource
availability on organisms and populations of organisms in an ecosystem.
MS-LS2-2:
Construct an explanation that predicts patterns of interactions among organisms
in a variety of ecosystems.
MS-LS2-3: Develop a model to describe the cycling
of matter and flow of energy among living and nonliving parts of an ecosystem.
MS-LS2-4:
Construct an argument supported by empirical evidence that changes to physical
or biological components of an ecosystem affect populations.
MS-LS2-5:
Evaluate competing design solutions for maintaining biodiversity and protecting
ecosystem stability.