Disaster Preparedness in New York
Ms. Caceres’ Third Grade STEM Scholars PS 273Q
INTRODUCTION
|
Click HERE to learn more about the American Red Cross. |
Watch the video: Superstorm 2012-Hurricane Sandy
You and your classmates are forming a Disaster Team in collaboration with the American Red Cross. There are currently not enough emergency preparedness resources for Natural Disasters within our city and state.
Your mission is to help other students and their families be prepared for Natural Disasters that typically occur in New York. |

TASK
|
|
1. You will complete a survey to determine how prepared for disasters we as New Yorkers currently are. 2. Your team will create a bar graph in Google Slides indicating which Natural Disasters occur and are most common in New York City and New York State. 3. You will create a Google Slides Presentation including your graph to present to Mayor Adams and Governor Hochul that outlines facts/ precautions that will keep New Yorkers safe. 4. Create a preparedness kit and communication plan with your family. |
PROCESS/RESOURCES
|
Day 1 |
1. Tune into this important message from Stormy Cyborg! Discuss your reactions to the video you saw on Hurricane Sandy with your team of 5. Pose problems your team noticed about the level of preparedness of New Yorkers. |
|
Day 2 |
1. Read the article, “These Natural Disasters Can Occur in New York! Are You Prepared?” 2. Click here to complete surveys on your level of preparedness to different natural disasters that are most common in New York State. |
|
Day 3 |
1. Watch How to Create Bar Graphs on Google Slides. Using teacher provided percentages, create a bar graph in Google Slides that reflects third graders level of preparedness. 2. Begin researching ideas on how New York students and families like you can be prepared at https://www.ready.gov/kids . 3. Check on current disaster plans for New York on FEMA at https://www.fema.gov/locations/new%20york . |
|
Day 4 |
1. With your team, begin working on your Google Slides Presentation. Include your bar graph slide. 2. Use the link to this template to help outline each slide of your presentation through the PPA model |
|
Day 5
REMEMBER! |
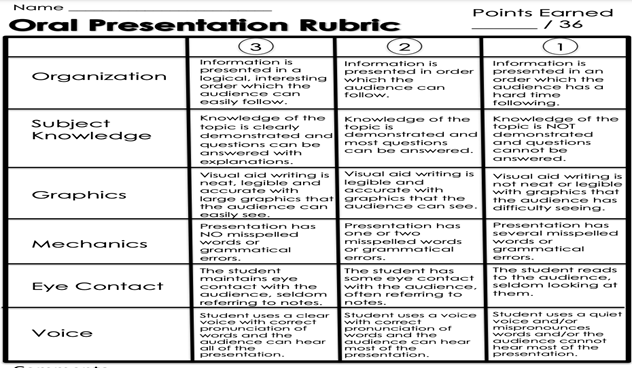
1. Present your slides to the class as if you were presenting to Governor Hochul and Mayor Adams. Your finished presentation should: 1. Define the problem 2. Gather evidence (surveys, articles, bar graph video, presentation template) 3. Identify the causes (articles, ready.gov website) 4. Evaluate an existing policy (FEMA New York site) 5. Develop solutions (ready.gov website) 6. Select the best solutions |
EVALUATION
CONCLUSION
During this unit we have examined natural disasters and the devastating effects they can have on communities. Although we cannot prevent natural disasters from occurring, our class has taken this problem and created solutions so that our fellow New Yorkers are better prepared.
STANDARDS
3L3: Recognize differences between the conventions of spoken conversational English and academic English; signal this awareness by selecting conversational or academic forms when speaking or writing.
3L4: Determine or clarify the meaning of unknown and multiple-meaning words and phrases, choosing flexibly from a range of strategies.
3L6: Acquire and accurately use conversational, general academic, and content-specific words and phrases, including those that signal spatial and temporal relationships (e.gAfter dinner that night we went out for dessert).
3.MD.3 Draw a scaled picture graph and a scaled bar graph to represent a data set with several categories. Solve one- and two-step “how many more” and “how many less” problems using information presented in scaled bar graphs. For example, draw a bar graph in which each square in the bar graph might represent 5 pets.